环境
python3.8,启动脚本前打开终端控制台的屏幕录制权限
用到的依赖包: pip install aiohttp aiortc opencv-python mss numpy pyobjc-framework-Quartz
pip install pyautogui
脚本代码
pythonimport asyncio
import json
import cv2
import numpy as np
import mss
from aiohttp import web
from aiortc import RTCPeerConnection, RTCSessionDescription, VideoStreamTrack
from av import VideoFrame

# --- 鼠标库 ---
try:
    from Quartz import CGEventCreate, CGEventGetLocation
    def get_mouse_pos_fast():
        evt = CGEventCreate(None)
        loc = CGEventGetLocation(evt)
        return loc.x, loc.y
except ImportError:
    import pyautogui
    def get_mouse_pos_fast():
        return pyautogui.position()

# ==========================================
# 🚀 终极画质配置
# ==========================================
# 设置为 True:启用原生点对点(不做任何缩放)
# 优点:清晰度天花板,文字锐利
# 缺点:带宽占用极大 (20-50Mbps),仅限局域网
USE_NATIVE_RESOLUTION = True

# 如果上面设为 False,则限制最大宽度 (如 2560 或 1920)
MAX_WIDTH = 2560

class ScreenCaptureTrack(VideoStreamTrack):
    kind = "video"

    def __init__(self):
        super().__init__()
        self.mss = mss.mss()
        self.monitor = self.mss.monitors[1]

        # 获取原始物理分辨率
        self.raw_w = self.monitor['width']
        self.raw_h = self.monitor['height']

        # 决定最终推流分辨率
        if USE_NATIVE_RESOLUTION:
            self.width = self.raw_w
            self.height = self.raw_h
        else:
            # 等比缩放逻辑
            if self.raw_w > MAX_WIDTH:
                ratio = MAX_WIDTH / self.raw_w
                self.width = int(self.raw_w * ratio)
                self.height = int(self.raw_h * ratio)
            else:
                self.width = self.raw_w
                self.height = self.raw_h

        # ⚠️ 编码器硬性要求:宽和高必须是偶数
        # 如果是奇数,我们减去 1 像素,否则会报错或绿屏
        if self.width % 2 != 0: self.width -= 1
        if self.height % 2 != 0: self.height -= 1

        print(f"✨ 终极画质模式: {'原生 Retina' if USE_NATIVE_RESOLUTION else '缩放模式'}")
        print(f"📺 物理分辨率: {self.raw_w}x{self.raw_h}")
        print(f"🚀 发送分辨率: {self.width}x{self.height}")

    async def recv(self):
        pts, time_base = await self.next_timestamp()

        # 1. 抓取 (原生 BGRA 数据)
        sct_img = self.mss.grab(self.monitor)
        img = np.array(sct_img)

        # 2. 预处理
        # 如果需要缩放(非原生模式),使用 INTER_AREA 插值
        if self.width != self.raw_w or self.height != self.raw_h:
            img = cv2.resize(img, (self.width, self.height), interpolation=cv2.INTER_AREA)
        else:
            # 如果是原生模式,但原始分辨率是奇数,需要裁剪掉最后 1 像素
            if img.shape[1] != self.width or img.shape[0] != self.height:
                img = img[:self.height, :self.width]

        # 3. 极速转色 (BGRA -> BGR) - 这是最耗时的步骤之一
        # M1 上这一步由于内存带宽大,速度很快
        img = cv2.cvtColor(img, cv2.COLOR_BGRA2BGR)

        # 4. 封装
        frame = VideoFrame.from_ndarray(img, format="bgr24")
        frame.pts = pts
        frame.time_base = time_base
        return frame

pcs = set()

async def offer(request):
    params = await request.json()
    offer = RTCSessionDescription(sdp=params["sdp"], type=params["type"])

    pc = RTCPeerConnection()
    pcs.add(pc)

    pc.addTrack(ScreenCaptureTrack())

    @pc.on("datachannel")
    def on_datachannel(channel):
        if channel.label == "mouse":
            asyncio.ensure_future(send_mouse_data(channel))

    @pc.on("connectionstatechange")
    async def on_connectionstatechange():
        if pc.connectionState == "failed":
            await pc.close()
            pcs.discard(pc)

    await pc.setRemoteDescription(offer)
    answer = await pc.createAnswer()
    await pc.setLocalDescription(answer)

    return web.json_response({
        "sdp": pc.localDescription.sdp,
        "type": pc.localDescription.type
    })

async def send_mouse_data(channel):
    with mss.mss() as sct:
        monitor = sct.monitors[1]
        w, h = monitor['width'], monitor['height']
        l, t = monitor['left'], monitor['top']

        while channel.readyState == "open":
            try:
                mx, my = get_mouse_pos_fast()
                pct_x = (mx - l) / w
                pct_y = (my - t) / h
                msg = json.dumps({"x": round(pct_x, 5), "y": round(pct_y, 5)})
                channel.send(msg)
                await asyncio.sleep(0.015)
            except Exception:
                break

async def on_shutdown(app):
    coros = [pc.close() for pc in pcs]
    await asyncio.gather(*coros)
    pcs.clear()

async def index(request):
    return web.Response(content_type="text/html", text=HTML_TEMPLATE)

# --- 前端代码:暴力 50Mbps 带宽 ---
# --- 前端代码:暴力 50Mbps 带宽 + 像素化小鼠标 ---
HTML_TEMPLATE = """
<!DOCTYPE html>
<html lang="en">
<head>
    <meta charset="UTF-8">
    <meta name="viewport" content="width=device-width, initial-scale=1.0">
    <title>Native Retina Stream</title>
    <style>
        body { margin: 0; background: #000; height: 100vh; width: 100vw; overflow: hidden; display: flex; justify-content: center; align-items: center; }

        #container { position: relative; width: 100%; height: 100%; display: flex; justify-content: center; align-items: center; }

        video {
            max-width: 100%; max-height: 100%;
            object-fit: contain;
            cursor: none;
            box-shadow: none;
        }

        #remote-cursor {
            position: absolute; top: 0; left: 0;

            /* 【改动 1】极致小尺寸:12px */
            width: 12px; height: 12px;

            pointer-events: none; z-index: 999; display: none;
            transition: none;

            /* 像素化渲染 */
            image-rendering: pixelated;
            image-rendering: crisp-edges;
            filter: none;
        }

        #stats {
            position: absolute; top: 10px; left: 10px; color: lime; font-family: monospace;
            background: rgba(0,0,0,0.5); padding: 5px; border-radius: 5px; pointer-events: none;
        }
    </style>
</head>
<body>
    <div id="stats">连接中...</div>
    <div id="container">
        <video id="video" autoplay playsinline muted></video>

        <svg id="remote-cursor" viewBox="0 0 24 24" fill="none" xmlns="http://www.w3.org/2000/svg">
            <path d="M5 5L12 21L14.5 13.5L22 11L5 5Z" fill="black" stroke="white" stroke-width="2"/>
        </svg>
    </div>

    <script>
        const pc = new RTCPeerConnection();
        const video = document.getElementById('video');
        const cursor = document.getElementById('remote-cursor');
        const stats = document.getElementById('stats');

        function updateCursor(x_pct, y_pct) {
            if (video.videoWidth === 0) return;
            const vw = video.videoWidth;
            const vh = video.videoHeight;
            const cw = video.clientWidth;
            const ch = video.clientHeight;

            const videoRatio = vw / vh;
            const containerRatio = cw / ch;

            let drawWidth, drawHeight, startX, startY;

            if (containerRatio > videoRatio) {
                drawHeight = ch;
                drawWidth = ch * videoRatio;
                startX = (cw - drawWidth) / 2;
                startY = 0;
            } else {
                drawWidth = cw;
                drawHeight = cw / videoRatio;
                startX = 0;
                startY = (ch - drawHeight) / 2;
            }

            const rect = video.getBoundingClientRect();
            const finalX = rect.left + startX + (drawWidth * x_pct);
            const finalY = rect.top + startY + (drawHeight * y_pct);

            cursor.style.transform = `translate3d(${finalX}px, ${finalY}px, 0)`;
            cursor.style.display = 'block';
        }

        const dc = pc.createDataChannel("mouse", {ordered: false, maxRetransmits: 0});
        dc.onmessage = (e) => requestAnimationFrame(() => {
            const data = JSON.parse(e.data);
            updateCursor(data.x, data.y);
        });

        pc.ontrack = (evt) => {
            if (evt.track.kind === 'video') {
                video.srcObject = evt.streams[0];
                video.onloadedmetadata = () => {
                    stats.innerText = `RES: ${video.videoWidth}x${video.videoHeight}`;
                };
            }
        };

        async function start() {
            pc.addTransceiver('video', {direction: 'recvonly'});
            const offer = await pc.createOffer();
            await pc.setLocalDescription(offer);

            const res = await fetch('/offer', {
                method: 'POST',
                body: JSON.stringify({sdp: pc.localDescription.sdp, type: pc.localDescription.type}),
                headers: {'Content-Type': 'application/json'}
            });

            const ansData = await res.json();
            let sdp = ansData.sdp;

            // 50Mbps 暴力带宽
            const bandwidth = 50000;
            if(sdp.indexOf("b=AS:") === -1) {
                sdp = sdp.replace(/m=video (.*)\\r\\n/g, "m=video $1\\r\\nb=AS:" + bandwidth + "\\r\\n");
            } else {
                sdp = sdp.replace(/b=AS:\\d+/, "b=AS:" + bandwidth);
            }

            await pc.setRemoteDescription(new RTCSessionDescription({sdp: sdp, type: ansData.type}));
        }

        start();
    </script>
</body>
</html>
"""

if __name__ == "__main__":
    app = web.Application()
    app.on_shutdown.append(on_shutdown)
    app.router.add_get("/", index)
    app.router.add_post("/offer", offer)
    print("🚀 终极画质版启动: http://0.0.0.0:5080")
    print("注意:此模式需要非常好的 Wi-Fi (5Ghz) 或有线网络")
    web.run_app(app, host="0.0.0.0", port=5080)
由于树结构数据过于多,需要改造成懒加载形式,因此要改造原先的级联框为懒加载模式,改造后懒加载数据回显就成了一个难题。。。
先看效果
实现核心代码
js// cascader是级联框的 ref,调用lazyLoad方法即可自动调用懒加载事件回显内容
this.$refs.cascader.panel.lazyLoad();
最近开发一个 h5 的智能体问答的程序出现一个奇怪的问题,安卓系统可以流式输出内容,ios 在 app 内不能流式输出,自带浏览器内可以流式输出。
经过各种排查,排除服务端的配置问题,最后在 ios 的流式输出请求中的 headers 内加入Accept:text/event-stream解决。可能牵扯到安卓和 ios 的 浏览器内核不同导致。
element ui文档中没有提供修改全局修改默认图标的办法,由于使用了太多的v-loading指令,需要直接修改他的默认样式。
修改后效果
 通过重写ElLoading的方式实现,具体如下:
1、在plugins文件夹下新建wrapElLoading.ts文件
tsimport {ElLoading} from "element-plus";

/**
 * @description 扩展ElLoading,传入默认值
 */
export default {
    install(app: any) {
        const svg: string = `<path d="M21.38,4.58a4.62,4.62,0,0,0,9.24,0h0a4.62,4.62,0,0,0-9.24,0Z" fill="#9ab1c9"/><path d="M6.33,10.39a3.75,3.75,0,0,0,7.49,0h0a3.75,3.75,0,0,0-7.49,0Z" fill="#9ab1c9"/><path d="M0,25.86a3.43,3.43,0,0,0,6.86,0h0a3.41,3.41,0,0,0-3.43-3.4A3.41,3.41,0,0,0,0,25.85Z" fill="#9ab1c9"/><path d="M6.88,41.66a3.2,3.2,0,1,0,3.2-3.17A3.18,3.18,0,0,0,6.88,41.66Z" fill="#9ab1c9"/><path d="M23.32,47.35a2.68,2.68,0,0,0,5.36,0h0a2.68,2.68,0,0,0-5.36,0Z" fill="#9ab1c9"/><path d="M39.68,41.66a2.14,2.14,0,0,0,4.28,0h0a2.14,2.14,0,0,0-4.28,0Z" fill="#9ab1c9"/><path d="M46.85,26A1.58,1.58,0,0,0,50,26h0a1.58,1.58,0,0,0-3.15,0Z" fill="#9ab1c9"/><path d="M40.77,10.2a1.12,1.12,0,1,0,1.12-1.11A1.12,1.12,0,0,0,40.77,10.2Z" fill="#9ab1c9"/>`;
        const loadingDir: any = ElLoading.directive
        const originDirMounted = loadingDir.mounted;
        loadingDir.mounted = function (el: any, binding: any, vnode: any, prevVnode: any) {
            // 需要覆盖哪些默认属性值在这里设置,具体属性名参考官网loading指令用法
            el.setAttribute('element-loading-svg', svg)
            originDirMounted.call(this, el, binding, vnode, prevVnode)
        }
        const originService = ElLoading.service;
        ElLoading.service = function (options: any = {}) {
            return originService.call(this, Object.assign({ svg}, options))
        }
        app.config.globalProperties.$loading = ElLoading.service;
        // 如果在main.ts中全局使用了ElementPlus —> app.use(ElementPlus),则下面这行代码不需要
        // app.use(ElLoading);
    }
}
2、在main.ts中use即可
jsimport WrapElLoading from "@/plugins/wrapElLoading";

// 若项目采用全局引入ElementPlus,则须在app.use(ElementPlus)后执行
app.use(WrapElLoading);
———————————————— 版权声明:本文为CSDN博主「倾城烟雨墨」的原创文章,遵循CC 4.0 BY-SA版权协议,转载请附上原文出处链接及本声明。 原文链接:https://blog.csdn.net/qq_34743346/article/details/135165317
由于项目中需要对code-editor库的编辑代码进行修改,于是调研了下修改方式,当前的网络的文档也很少。
修改前后展示
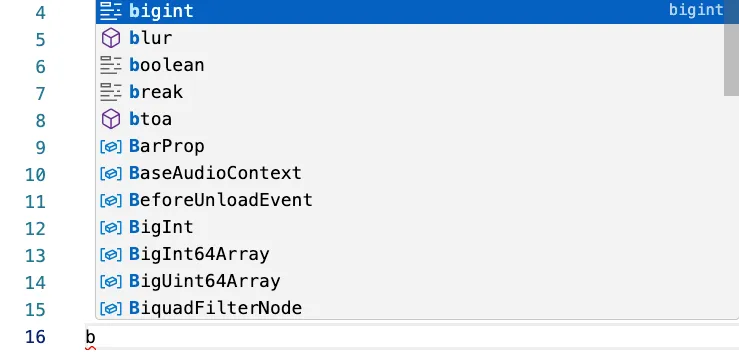 |  |
|---|
核心代码
javascriptmanaco.editor.defineTheme('custmer', {
	base: 'vs',
	inherit: false,
	rules: [],
	colors: {
		['editorSuggestWidget.background']: '#000000',
	}
})
这段代码意思是定义一个custmer主题,基础vs主题,后面使用custmer主题即可修改样式。